How does AI rank the parties in your municipality for 2026?
LLMEKNOW asks AI assistants the questions your customers ask, on their behalf, and reads the AI answers. We used it on an election so you can see how it works.
We asked six AI models one question on behalf of 1,247 simulated registered voters. The voters are spread across every metro and district municipality in proportion to the voters’ roll. The map shows the party each AI model ranks first, at the municipal level. The report below has three parts: what the AI models answered, whether the AI answers follow the 2024 election result or the 2026 polls, and the reasons, the issues and the effect of the voter profile. The page is an experiment in reading AI answers, and every voter in it is simulated. Councils allocate seats in proportion to the votes for each party, so the report looks at each party’s percentage and at whether any party wins more than half, and compares both with the real results and the polls.
South Africa, September 2026
South Africa
 ANC36
ANC36 MK Party8
 DA6
DA6 IFP2How to read this map
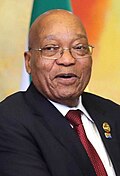 Jacob ZumaMK Party
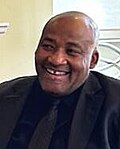 Gayton McKenzie
 Patriotic Alliance
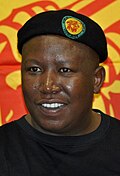 Julius Malema
 EFF
EFF
Boundaries: Municipal Demarcation Board, via the Electoral Commission. Town and voter locations: GeoNames (CC BY 4.0). Party logos: the parties’ own marks, shown at icon size for identification. Voters' roll as at 3 September 2026. Wave of September 2026.
What we found
- In most municipalities the AI models rank the ANC first, with less than half of the vote. For four of the five AI models, no party has more than half of the vote in 72 to 83% of the AI answers. For Grok, in 35%.
- Across the country the ANC’s share of the vote in the AI answers is about 37%. Its 2024 election result was 40% and its share in the July 2026 poll is 34%. The DA’s share of the vote in the AI answers is 22%, its 2024 election result; in the July 2026 poll it is 27%. MK Party’s share of the vote in the AI answers is 12%; in the July 2026 poll, 15%. The EFF’s share of the vote in the AI answers is 13%, above every poll and result. The IFP’s share of the vote in the AI answers equals its share in the July 2026 poll.
- The AI answers name ActionSA in 37% of cases, the Patriotic Alliance in 40% and Freedom Front Plus in 28%, almost only in the provinces where each party is strong. Across the country each party’s share of the vote in the AI answers is 3 to 5%, above its 2024 election result.
- In 38 of the 52 municipalities all five AI models rank the same party first. They differ in 14: nine districts in KwaZulu-Natal, where different models rank the ANC, MK Party or IFP first, Tshwane, Nelson Mandela Bay, and three districts in the Cape.
- We turned off web search, so each AI answer rests on the training data: the 2021 and 2024 election results and the news of the years between. The July 2026 poll differs from the 2024 election result by about 3 points per party. The AI answers differ from the 2024 election result by about 2.5 points, in the same direction as the July 2026 poll for four of the six parties, and from the July 2026 poll by about 3 points. The DeepSeek and ChatGPT shares are closest to the July 2026 poll; the Gemini shares are furthest. Most answers cite the 2024 and 2021 results as their evidence. About 6% cite a poll.
- The question ended with “and why?”, so each AI answer contains reasons for its ranking. Two reasons appear more than any other, in every AI model’s answers: the ANC loses support because of service delivery failures and corruption, and the EFF attracts young and unemployed voters. The issues change with the place. In eight provinces the AI answers name water and roads as the issues that decide the vote. In the Western Cape they name housing and crime.
- The AI answer depends on the municipality, and within one municipality the voter’s age and gender change it very little. The question was in English. Between 24% and 40% of each AI model’s answers were in another language, the voter’s home language, although nobody asked for that.
- Claude did not rank the parties in 75% of its answers. The other five AI models ranked them in 91 to 99% of their AI answers.
- For a brand the same rules apply. The AI answer depends on the location, and the reasons the AI gives are the same in every AI model’s answers. The information is two years old, whatever source the AI answer names. Between 24% and 40% of AI answers are in the customer’s own language. A trial shows you the AI answers for your category.
In their own words
One AI answer for any municipality and AI model.
Everything below is a reading of text like this. One AI answer per municipality and AI model, chosen to be typical of that AI model there in length and in the party it ranks first. Where the AI model answered in the voter’s language, the English translation is shown, as written. Party names are underlined in their colour.
Loading the answers…
Ask AI about your own market.
We asked about an election. Ask about your category, your competitors, your customers: six assistants, real answers, read for you.
Part I
What the AI models answered
Six AI models ranked the parties for 1,247 simulated voters in 52 municipalities. In most municipalities the AI answers rank the ANC first with less than half of the vote, so a coalition would govern. Across the country the ANC’s share of the vote in the AI answers is between the 2024 election result and the July 2026 poll. In 14 municipalities the AI models rank different parties first.
Who the AI ranks first
In most municipalities the AI ranks the ANC first, with less than half of the vote. A coalition would govern.
Councils allocate seats in proportion to the votes. The party with the most votes controls the council only if it has more than half. Pick a province. The left chart shows how often the AI ranks each party first in each municipality. The right chart shows the share of AI answers in which no party has more than half.
Eastern Cape: which party the AI ranks first, share of AI answers per municipality
Answers from the five AI models that ranked the parties, added together. Municipalities in order of registered voters.
- ANC
- DA
- MK Party
- IFP
- Other
Eastern Cape: AI answers in which no party has more than half
A hung council. A coalition or a minority administration governs.
The Eastern Cape: the ANC is ranked first by most AI models in 8 of the 8 municipalities, and the AI models are split in 2 of them. The share of AI answers in which no party has a majority runs from 35% in Alfred Nzo to 92% in Nelson Mandela Bay. Across all 52 municipalities, for four of the five AI models no party has more than half in 72% to 83% of the AI answers, and for Grok in 35%. Most answers also name a kingmaker, a small party whose support decides who governs. The next section adds the first places up across the country.
The pattern is the same in every province: the ANC first, and no party past half. The next section adds the AI answers up across the country and compares them with the polls.
Against the polls
Across the country the ANC’s share of the vote in the AI answers is about 37%: below its 2024 election result, above the July 2026 poll.
Every AI model ranks the ANC first for most voters: Grok for 74% of them, Gemini for 59%. The first chart shows this for each AI model. Large municipalities count for more than small ones. The second chart shows each party’s share of the vote in the AI answers next to the July 2026 poll, the September poll and the 2024 election result. The third chart shows the three smaller parties on their own scale. Claude did not rank the parties in 75% of its answers, so the charts from here on use the five AI models that did.
Share of voters whose AI answer ranks each party first, by AI model
Each bar is one AI model. Large municipalities count for more than small ones. Parties that no municipality ranks first are grouped as Other.
- ANC
- DA
- MK Party
- IFP
- Other
Across the five AI models that ranked the parties, the ANC’s share of AI answers ranking it first runs from 59% (Gemini) to 74% (Grok), and the DA’s from 14% (Grok) to 24% (ChatGPT). The order of the parties is the same in every bar, so the AI models differ in degree and agree on the order. A first place counts only the party at the top of each AI answer. The next chart reads the percentages inside the AI answers as vote shares, which is what the polls measure.
Each party’s share of the vote in the AI answers, against the polls and the 2024 election result
Each row is a party. The tick is the party’s share of the vote in the AI answers across the country; large municipalities count for more than small ones. The bar covers the middle 50% of municipalities. 40% of AI answers contain percentages. The method notes describe how we read them.
- AI answers: middle 50%, tick at the median
- Victory Research, Jul 2026
- Ipsos, Sep 2026
- 2024 national result
The ANC’s share of the vote in the AI answers, 36.6%, is between its 2024 result (40.3%) and the July 2026 poll (34%). The DA’s share, 22.4%, is within a point of its 2024 election result (21.7%) and below the July 2026 poll’s 27%. MK Party’s share is 11.6% against 15% in the July 2026 poll, and the EFF’s share, 12.6%, is above both its 2024 election result and the July 2026 poll. The bars, the middle 50% of municipalities, are widest for the ANC and MK Party, whose shares differ most from place to place. Part II measures these differences party by party. The last chart in this section shows the three smaller parties, which a map of first places hides.
Each party’s share of the vote in the AI answers, against the 2021 and 2024 results and the July 2026 poll
Each row is a party. The tick is the party’s share of the vote in the AI answers across all 52 municipalities. The bar covers the middle 50% of municipalities. The July 2026 poll has no figure for the Patriotic Alliance or Freedom Front Plus.
- AI answers: middle 50%, tick at the median
- 2021 local result
- 2024 national result
- Victory Research, Jul 2026
- Median in the AI answers that name the party
ActionSA is named in 37% of AI answers, and in 92% in Gauteng; its share of the vote in the AI answers is 3.9% against 1.2% in 2024. Freedom Front Plus is named in 28% of AI answers, and in 58% in the Free State; its share of the vote in the AI answers is 3.2% against 1.4% in 2024. Patriotic Alliance is named in 40% of AI answers, and in 88% in the Western Cape; its share of the vote in the AI answers is 4.6% against 2.1% in 2024. The AI answers carry each party where it was visible in 2024, add 1.8 to 2.7 points, and leave it out elsewhere, so no municipality’s AI answers rank any of the three first. The Patriotic Alliance comes closest: the AI ranks it first in Central Karoo in 7 answers, and second in Cape Town in 64.
The three smaller parties are named where each is strong and left out elsewhere. The next section shows the 14 municipalities where the five AI models rank different parties first.
Where the AI models differ
In 38 municipalities all five AI models rank the same party first. They differ in 14: 9 districts in KwaZulu-Natal, two metros and three districts in the Cape.
Each dot is the party an AI model ranks first for most voters in that municipality. A grey dot means the AI model did not rank the parties there; this is nearly always Claude. Most of the differences are in KwaZulu-Natal, where different models rank the ANC, MK Party or IFP first.
The party each AI model ranks first, in the 14 municipalities where the AI models differ
Each cell is the party an AI model ranks first. Municipalities grouped by province, largest group first, then by registered voters; models ordered by how often they agree with the others. On a phone, scroll the grid sideways to see all six AI models.
In the 9 KwaZulu-Natal districts the first party is the ANC, MK Party or the IFP, depending on the AI model: the three parties finished close in 2024, and the AI models order them differently. Tshwane splits between the DA and the ANC; Nelson Mandela Bay splits between the DA and the ANC. The 3 other districts, in the Western Cape, the Northern Cape and the Eastern Cape, split between the DA, the Patriotic Alliance and the ANC. Every split is between parties that finished close in 2024. Across all 52 municipalities, DeepSeek and Gemini agree most (90%); Claude and DeepSeek least (76%). Weighted by the voters’ roll, the municipalities where most AI models rank the ANC first hold 68% of all registered voters, and the 14 split municipalities hold 22% of them, Tshwane and Nelson Mandela Bay among them.
Part II asks where these shares come from: the 2024 election result, or the polls of 2026.
Part II
The 2024 election result or the 2026 polls
We turned off web search, so the AI models answered from their training data alone: the 2021 and 2024 election results and the news of the years between. The AI answers moved from the 2024 election result only part of the way toward the July 2026 poll, and most of them cite the two results as their evidence.
Compared with the results and the July 2026 poll
The July 2026 poll differs from the 2024 election result by about 2.9 points per party. The AI answers differ from the 2024 election result by about 2.5 points, so they moved part of the way toward the July 2026 poll.
The chart shows the two results, the July 2026 poll and the party’s share of the vote in the AI answers on one line per party. The thin line shows the difference between the 2024 election result and the July 2026 poll, and the thick line the difference between the 2024 election result and the AI answers. Blue means the party’s share rose from 2024, rust means it fell. The distance between the two dots shows the difference between the AI answers and the July 2026 poll.
Across the country, per party: the 2021 election result, the 2024 election result, the July 2026 poll and the share of the vote in the AI answers
Results: Electoral Commission, added up over the 52 metros and districts. Poll: Victory Research, July 2026, with no figure for the Patriotic Alliance or Freedom Front Plus. AI: each party’s share of the vote in the AI answers, weighted by registered voters.
- 2021 election result
- 2024 election result
- poll, July 2026: the thin line is how far it moved on from 2024
- AI, for November 2026: the thick line is how far it moved on from 2024
- rose from 2024
- fell from 2024
On every line the blue dot is near the grey one. For 4 of the 6 parties in the July 2026 poll, the AI answers differ from the 2024 election result in the same direction as the July 2026 poll, and the average gap between the AI answers and the July 2026 poll, 3 points, is about the size of the July 2026 poll’s own distance from 2024, 2.9 points. The AI answers are the 2024 election result with a shift of a few points towards the July 2026 poll. The next chart plots the two shifts against each other, one dot per party and place.
Per party: the July 2026 poll’s difference from the 2024 election result, against the AI answers’ difference from the 2024 election result
One dot per party, nationally and in the Johannesburg, Tshwane and eThekwini polls. Across: the July 2026 poll minus the 2024 election result. Up: the AI answers minus the 2024 election result. Dashed line: the same change as the July 2026 poll. Flat line: no change from 2024.
- ANC
- DA
- MK Party
- IFP
- Other
Of the 21 dots, 17 are in the two quarters where the AI answers and the July 2026 poll differ from 2024 in the same direction, 2 are on the flat line with the share of the vote in the AI answers equal to the 2024 election result, and 2 are in the opposite quarters; the largest of those is EFF nationally. For 12 of the 21 dots the AI answers shift by less than the July 2026 poll. The three metro charts below show where the shifts are largest.
City of Johannesburg
Per party: poll minus 2024 about 8.7 points, answers minus 2024 about 2.5, answers minus poll about 7.8. Poll: Victory Research, July 2026.
- 2021 election result
- 2024 election result
- poll, July 2026: the thin line is how far it moved on from 2024
- AI, for November 2026: the thick line is how far it moved on from 2024
- rose from 2024
- fell from 2024
Ipsos, September 2026, metro subsample: ANC 31%, DA 27%.
City of Tshwane
Per party: poll minus 2024 about 6.6 points, answers minus 2024 about 2.8, answers minus poll about 4.7. Poll: Victory Research, July 2026.
- 2021 election result
- 2024 election result
- poll, July 2026: the thin line is how far it moved on from 2024
- AI, for November 2026: the thick line is how far it moved on from 2024
- rose from 2024
- fell from 2024
Ipsos, September 2026, metro subsample: DA 31%, ANC 22%.
eThekwini
Per party: poll minus 2024 about 8.1 points, answers minus 2024 about 7.8, answers minus poll about 2.8. Poll: Victory Research, July 2026.
- 2021 election result
- 2024 election result
- poll, July 2026: the thin line is how far it moved on from 2024
- AI, for November 2026: the thick line is how far it moved on from 2024
- rose from 2024
- fell from 2024
Ipsos, September 2026, metro subsample: MK Party 55%.
In the metros the July 2026 poll differs from 2024 by 8.7 points in Johannesburg, 6.6 points in Tshwane and 8.1 points in eThekwini, more than the 2.9 points nationally. The AI answers follow the July 2026 poll most closely in eThekwini, where they differ from 2024 by 7.8 points and from the July 2026 poll by 2.8. In Johannesburg the AI answers stay within 2.5 points of 2024 while the July 2026 poll has moved 8.7, so the gap is 7.8 points. MK Party’s rise in eThekwini is in the 2024 election result and in the training data, and the AI answers carry it; the shifts in the Gauteng metros are newer, and the AI answers hold the 2024 shares there. The last chart splits the national gap by AI model.
Per AI model: the difference from the 2024 election result, and the difference from the July 2026 poll
National figures, one AI model at a time. Each figure is the average over the six parties in the July 2026 poll, in percentage points. A model’s answers can differ a lot from 2024 and still be far from the July 2026 poll, if the differences are on the wrong parties.
Difference from the 2024 election result, points per party
Difference from the July 2026 poll, points per party (shorter is closer)
By AI model, DeepSeek is closest to the July 2026 poll at 2 points and Gemini is furthest at 6.5. Gemini differs most from 2024, by 6.6 points, and it is also the furthest from the July 2026 poll: its largest shifts are on the wrong parties.
The next section shows the evidence the AI answers name for their percentages. Most name the two election results. Few name a poll.
What the AI answers cite
Most answers cite the 2024 and 2021 results. About 6% cite a poll.
The evidence each AI answer names for its ranking, per AI model.
Evidence the AI answers name, as a share of AI answers, per AI model
Each row is a kind of evidence. The dots are the five AI models; the line is the range between them. Kinds of evidence named in fewer than 3% of every AI model’s answers are left out.
2024 national or provincial results are the evidence the AI answers name most, in 33% to 81% of AI answers depending on the AI model, and opinion polls are named in 2% to 14%. The shares in the previous section rest on the last two results and on reasoning from them, which is why they are within a few points of 2024. The next section shows the people the AI answers name.
The next section lists the people the AI answers name. They are national figures, and each is named where their party is strong.
Who the AI answers name
Jacob Zuma is named in 10.5% of AI answers and Gayton McKenzie in 7.1%. The sitting mayors of the biggest metros are named in fewer than 1%.
The people the AI answers name, as a share of all AI answers, then by AI model and by province. An AI answer can name several people or none. Party: the person’s current party.
People the AI answers name, as a share of all AI answers
Share of all 7,482 answers naming the person. Portraits: Wikimedia Commons.
People the AI answers name, per AI model
Each row is a person. The dots are the six AI models; the line is the range between them.
People the AI answers name, by province
Share of the province’s answers naming the person. Darker is a larger share.
How the AI answers write about each person
Each person’s mentions, split by the entity reader’s score: cool (below neutral), factual (a mention with no tone) and warm (above neutral). People the AI answers name in at least 40 AI answers.
- Cool: written against the person
- Factual: named with no tone
- Warm: written for the person
Jacob Zuma is named most in KwaZulu-Natal (19.4% of its answers), Gayton McKenzie in the Western Cape (26.6%) and Julius Malema in Limpopo (12.0%): each is named where their party is strong, and the AI answers for the rest of the country leave them out. DeepSeek names people most often and Claude least, so the count of names depends on the AI model more than on the place. 64% of the mentions of Jacob Zuma carry no tone, a name attached to a party; among the rest, warm outnumber cool about 4 to one. The same answers write coolly about MK Party as a party, so the warmth is about his pull and the coolness about the party’s record. The AI answers write warmly about Geordin Hill-Lewis in 95% of mentions and coolly about Floyd Shivambu in 65%. The sitting mayors Nasiphi Moya, Geordin Hill-Lewis and Dada Morero are named in 0.8% of AI answers or fewer, so the AI answers rest on national leaders, and the people who run the councils are almost absent from them.
Part III lists the reasons the AI answers give, which are the same in every province, and the issues, which change with the place.
Part III
Reasons, issues and the voter
The same two reasons are in every AI model’s answers. The issues change with the place and follow the party the AI ranks first. The voter’s age and gender change the AI answer very little, and between 24% and 40% of AI answers come back in the voter’s home language.
Why the leader leads
The same two reasons are in every AI model’s answers: the ANC loses support because of service delivery failures, and the EFF attracts young and unemployed voters.
Between 70% and 90% of AI answers contain the reason that the EFF attracts young and unemployed voters. As many contain the reason that the ANC loses support because of service delivery failures. Between 50% and 67% contain the reason that the ANC still has the strongest local organisation. The AI models differ most on two reasons: whether people vote by ethnic identity, and whether independent candidates matter. Each row is a reason. The dots are the five AI models; the line is the range between them.
Share of AI answers that contain each reason, per AI model
The reasons the AI gives are the same everywhere. The next section shows the issues, which change with the place.
What decides the vote
In eight provinces the AI answers name water and roads as the main issues. In the Western Cape they name housing and crime.
Share of AI answers that name each issue as one that decides the vote in the voter’s municipality.
Issues the AI answers name as decisive: the 52 municipalities clustered by the issues their AI answers share
Each dot is a municipality, coloured by the party most AI models rank first there. A line joins each municipality to the four whose answers name the most similar set of issues, and to the places in its cluster it is most alike; a thicker, darker line is a closer match. The layout pulls similar places together. The shaded areas are five clusters found by grouping places with similar issue profiles; clicking a shaded area opens that cluster's profile beside it: what its answers share, what sets it apart, and which party the AI ranks first there. Hover a dot for its top issues.
- Water and roads, high on jobs36
- Water and roads, high on crime7
- Water and roads, high on refuse and sanitation4
- Water and housing4
- Crime and housing1
In the eight provinces outside the Western Cape, water is named in 75% to 91% of AI answers and roads in 61% to 81%. In the Western Cape the two issues named most are housing (53%) and crime (51%), and water is named in 43%. The reasons the AI gives, in the previous section, were the same everywhere; the issues change with the place, because the AI answers tie the ranking to the state of local services.
Clustered on their whole issue profile, the largest of the 5 clusters, water and roads, high on jobs (7 provinces), holds 36 municipalities whose answers share water (83%), roads (74%), jobs (58%). The clusters follow the party the AI ranks first: in the water and housing cluster (Western Cape) the AI ranks the DA first in 4 of 4 places, against 12% of all places. Where the AI answers rank a different party first, they also name different issues, and the issues are the reasons the AI answers give for the ranking. The map near the top of the page lists the issues for each municipality.
The last section asks whether the person asking changes the AI answer.
Who is asking
Within one municipality, the voter’s age and gender change the AI answer very little. Between 24% and 40% of AI answers are in the voter’s home language, although nobody asked for that.
Each voter had only an age band, a gender, a home town and a home language. The first chart shows, for each AI model and each age band, how often the AI answer ranks first the party the AI usually ranks first in that municipality. A flat line means the AI answer depends on the municipality alone. The youngest and oldest bands each have about twenty AI answers per AI model, so small changes there are noise.
Share of AI answers that rank first the party the AI usually ranks first in that municipality, by the voter’s age band
For every AI model the line is close to flat. The widest span across age bands is Grok’s, from 81% to 94%; the narrowest is Kimi’s, from 85% to 91%. The ends of each line rest on about twenty AI answers. Age changes the ranking very little. Language changes the form of the AI answer, which the two charts below measure.
AI answers given in the voter’s own language
The question was in English; the voter carried a home language. Share of each AI model’s answers that came back in a language other than English. Translated to English before reading.
By the voter’s language
The same measure by home language. This chart mixes municipalities. Most isiZulu speakers live in KwaZulu-Natal, where the AI models differ, so the isiZulu range is wide. Men and women differ by less than two points on every AI model.
Language of the AI answer, per AI model
Share of each AI model’s answers in each language, as detected before translation. Languages under 0.5% of an AI model’s answers are left out.
Between 24% (Grok) and 40% (Kimi) of answers came back in the voter’s home language, although the question was in English. By language, the share of AI answers that rank the municipality’s usual party first is lowest for isiZulu speakers (72%) and highest for isiXhosa speakers (95%), and the low end follows the split municipalities of KwaZulu-Natal, where most isiZulu speakers live, rather than the language. Across all models the non-English answers are mostly isiZulu (21.5%), Sesotho (5.6%) and Afrikaans (2.1%). A second AI reader scored how positively each AI answer writes about the four largest parties, from −3 to +3. Every AI model writes least positively about the EFF, −1.5 on average, and most positively about the party it ranks first.
The AI answer reader under the findings list, near the top of the page, shows the AI answers themselves.
Questions about this study
- Did LLMEKNOW poll any voters for this page?
- No. Every one of the 1,247 voters is simulated: a made-up person with only an age band, gender, home town and home language. The page reports what six AI models answered when those simulated voters asked them to rank the parties in their municipality. It is an experiment in reading AI answers, and the AI answers can be wrong.
- Which AI models were asked, and how?
- ChatGPT 5.6, Gemini 3 Flash, Grok 4.3, Kimi K2, DeepSeek V4 Flash and Claude Sonnet. Each simulated voter asked one question once, in English, on 4 September 2026, with web search turned off, so every AI answer rests on the AI model’s training data. That produced 7,482 AI answers.
- What does “ranked first” mean on the map?
- Ranked first means the party at the top of an AI answer’s ranking for that municipality. It is the largest share, which can be less than half of the vote. The map colours each municipality by the party most of the five ranking models put first; Claude did not rank the parties in 75% of its answers and is left out of that count.
- How do the AI answers compare with the real polls?
- Across the country the ANC’s share of the vote in the AI answers is about 37%, between its 2024 election result of 40% and the July 2026 Victory Research poll at 34%. Per party, the AI answers differ from the 2024 election result by about 2.5 points, and the July 2026 poll by about 3 points, so the AI answers moved only part of the way from the last result toward the polls. Most answers cite the 2024 and 2021 results as their evidence; about 6% cite a poll.
- Where does the data on this page come from?
- The voter sample follows the Electoral Commission’s voters’ roll of 3 September 2026. Election results are the Electoral Commission’s 2021 municipal and 2024 national results, added up to the 52 metros and districts. Polls are Victory Research (July and March 2026) and Ipsos (September 2026). Municipal boundaries come from the Municipal Demarcation Board via the Electoral Commission, and town locations from GeoNames. A sample of 312 AI answers with their full text is published as JSON on this page.
- How is the tone of a mention scored, and why is Jacob Zuma mostly “factual”?
- A second AI reader scores every mention of a person from 0 (written against them) to 1 (written for them), with 0.5 for a mention that carries no tone. Most political mentions are of that kind: “Zuma’s MK Party” or “led by Jacob Zuma” attaches a name to a party without judging the person. Two thirds of Zuma’s 799 mentions score exactly 0.5 for that reason. Among the rest, warm outnumber cool about four to one, because the AI answers describe his pull in KwaZulu-Natal, while a separate reader that scores parties has MK Party below neutral on every AI model. An average of all mentions would hide this, so the page reports the split instead of a mean.
- Can I reuse the figures and the data?
- Yes, with attribution to LLMEKNOW (Murmur Intelligence). The figures on this page and the published sample of AI answers are released under a Creative Commons Attribution 4.0 licence. Party logos and portraits belong to their owners and are shown at icon size for identification.
The data behind the page: a sample of 312 AI answers with their full text is published as JSON, under a Creative Commons Attribution 4.0 licence. Last updated .
How the voters were built
The 1,247 voters are spread across the 8 metros and 44 district municipalities in proportion to the registered voters’ roll, which the Electoral Commission published on 3 September 2026. Each municipality has a floor of ten voters, so that every district is represented. Within each municipality, age band and gender follow the same roll, home towns follow the local municipalities, and language follows the dominant languages of the area. A voter carries nothing else: no income, education, party history or opinions.
How the AI answers were read
Each voter asked the one question once, in English, with no web search, on 4 September 2026. The AI models were ChatGPT 5.6, Gemini 3 Flash, Grok 4.3, Kimi K2, DeepSeek V4 Flash and Claude Sonnet. None was given the date, the election date or any document; each answered from its training data. Answers in other languages were translated to English before reading. No AI model was told its own knowledge cut-off, so we read it off the AI answers: every AI model mentions 2024 in 38% to 99% of its answers, and 2025 in only 1% (ChatGPT, Gemini) to 12% (Claude), so the AI answers rest on events up to 2024 with very little from 2025. A separate AI reader then scored every AI answer against a fixed set of statements, among them “the response ranks the ANC first in this municipality”, one per party. The party with the strongest score is the party the AI ranks first. The same reader scored whether the AI answer has a hung council, and which reasons it contains. Every person named is scored from 0 to 1 for the tone of that mention, with 0.5 for a mention that carries no tone; the page reports the share of a person’s mentions below, at and above 0.5 rather than an average, because most mentions are factual and an average of them says little. Issues, evidence, institutions and politicians were extracted from the AI answers as named entities and grouped by keyword.
Where an AI answer contains a percentage for a party, we used it. About 40% of the AI answers from the five AI models that ranked the parties contain percentages. Two thirds of those AI answers came from ChatGPT and DeepSeek, whose answers contain percentages in 67% of cases. Gemini’s and Grok’s answers contain percentages in 25% of cases. We skipped a percentage that appeared in the same line as a past year, or with the words won, got, received, secured or polled, because it describes a past result. For each municipality we took the median percentage for each party. A party with no percentage in any answer for the municipality counts as 0. For the national and provincial figures we combined the 52 municipalities; large municipalities count for more than small ones. Where the page has a figure for the AI answers that name a party, that figure is the median over those AI answers alone.
Share-of-AI-answers figures such as the issues, the arguments and the hung-council share are unweighted counts of AI answers. Every district has a floor of ten voters, so the smallest districts are over-represented in these figures. Only the bars for the party the AI ranks first and the vote shares are re-weighted to the voters’ roll.
For the comparison with the election results and the July 2026 poll we aggregated the Electoral Commission’s 2021 municipal results and the 2024 national ballot to the same 52 metros and districts, summing the local municipalities inside each district. The 2021 figures are the combined municipal ballot; the 2024 figures are the national ballot counted in that area.
What this can and cannot tell you
The AI models answered from their training data, with no web search and no contact with any person, so their AI answers can be wrong. This page is no basis for deciding a vote.
This page reports one wave with one AI answer per voter, which cannot separate a real difference between models from run-to-run noise. At the youngest and oldest age bands each figure per AI model uses about twenty AI answers, so differences under ten points there are noise.
The 2021 figure is the combined municipal ballot. The 2024 figure is the national ballot counted in the same area. Outside the metros, about half of the AI answers rank the parties for a local municipality inside the district. The three are not the same contest or the same unit, and MK Party did not exist in 2021, so every comparison of MK with 2021 is a comparison with zero.
The polls ask a different question, and they ask real people, so a gap between a poll figure and a figure in the AI answers is a measure of the AI models.
Sources
- Victory Research for the Social Research Foundation and The Common Sense, Q1 and Q2 2026 surveys
- Inside Politics, Election 2026/7 series on turnout in the metros
- Ipsos, Pulse of the People, released 4 September 2026, via Daily Maverick
- Opinion polling tables, 2026 South African municipal elections
- 2024 national and provincial results, Electoral Commission results dashboard
- Voters’ roll by municipality, age and gender, Electoral Commission of South Africa
- 2021 municipal election results by municipality, Electoral Commission results dashboard
- 2024 national ballot results down to voting district, Electoral Commission downloadable results
- Municipal boundaries, Municipal Demarcation Board via the Electoral Commission
Ask AI about your own market.
We asked about an election. Ask about your category, your competitors, your customers: six assistants, real answers, read for you.